Flaky Tests Dashboard
Here we break down the Flaky Tests Dashboard, and how to use it to manage flaky tests.
Background
BuildPulse detects flaky tests in 2 different ways:
Git-Based: If we see a passing and failing result for a test case, but the code hasn't changed, we mark it as flaky. The way we determine if the source code has changed is by comparing the git tree SHAs.
Example: the set of test results across commits C1 and C2: [Pc1, Fc1, Pc1, Fc2, Pc2] has 3 disruptions (Pc1Fc1, Fc1Pc1, Fc2Pc2), 5 results, and a 60% disruption frequency.
Statistical Model: We analyze test case failures to determine flakiness. If the failure rate and count of results exceeds a configured threshold (Settings > Repository Settings > Thresholds > Detection Disruption Percentage), the test is marked as statistically flaky.
Overview
The dashboard gives you a high-level overview of your flaky tests, corresponding metrics, and filters by flaky tests type.
At the top, we show:
- Selected repository
- Total time consumed by flaky tests (sum of build durations that failed due to flakiness)
- Percentage of builds not affected by flakiness failures
- Code coverage percentage
- Bar chart of builds sent to BuildPulse
Tabs
- Metrics: Charts and metrics for flaky tests, disruptions, and time consumed.
- Flaky Tests: List of flaky tests with disruption details.
- Builds: List of builds sent to BuildPulse. Because a build can have multiple uploads, we group together uploads by build URL to construct a build.
- Tests: List of test cases and suites registered by BuildPulse - sortable by test durations and failure rates.
- Code Coverage: Directory view of repository that shows code coverage percentage by file/directory.
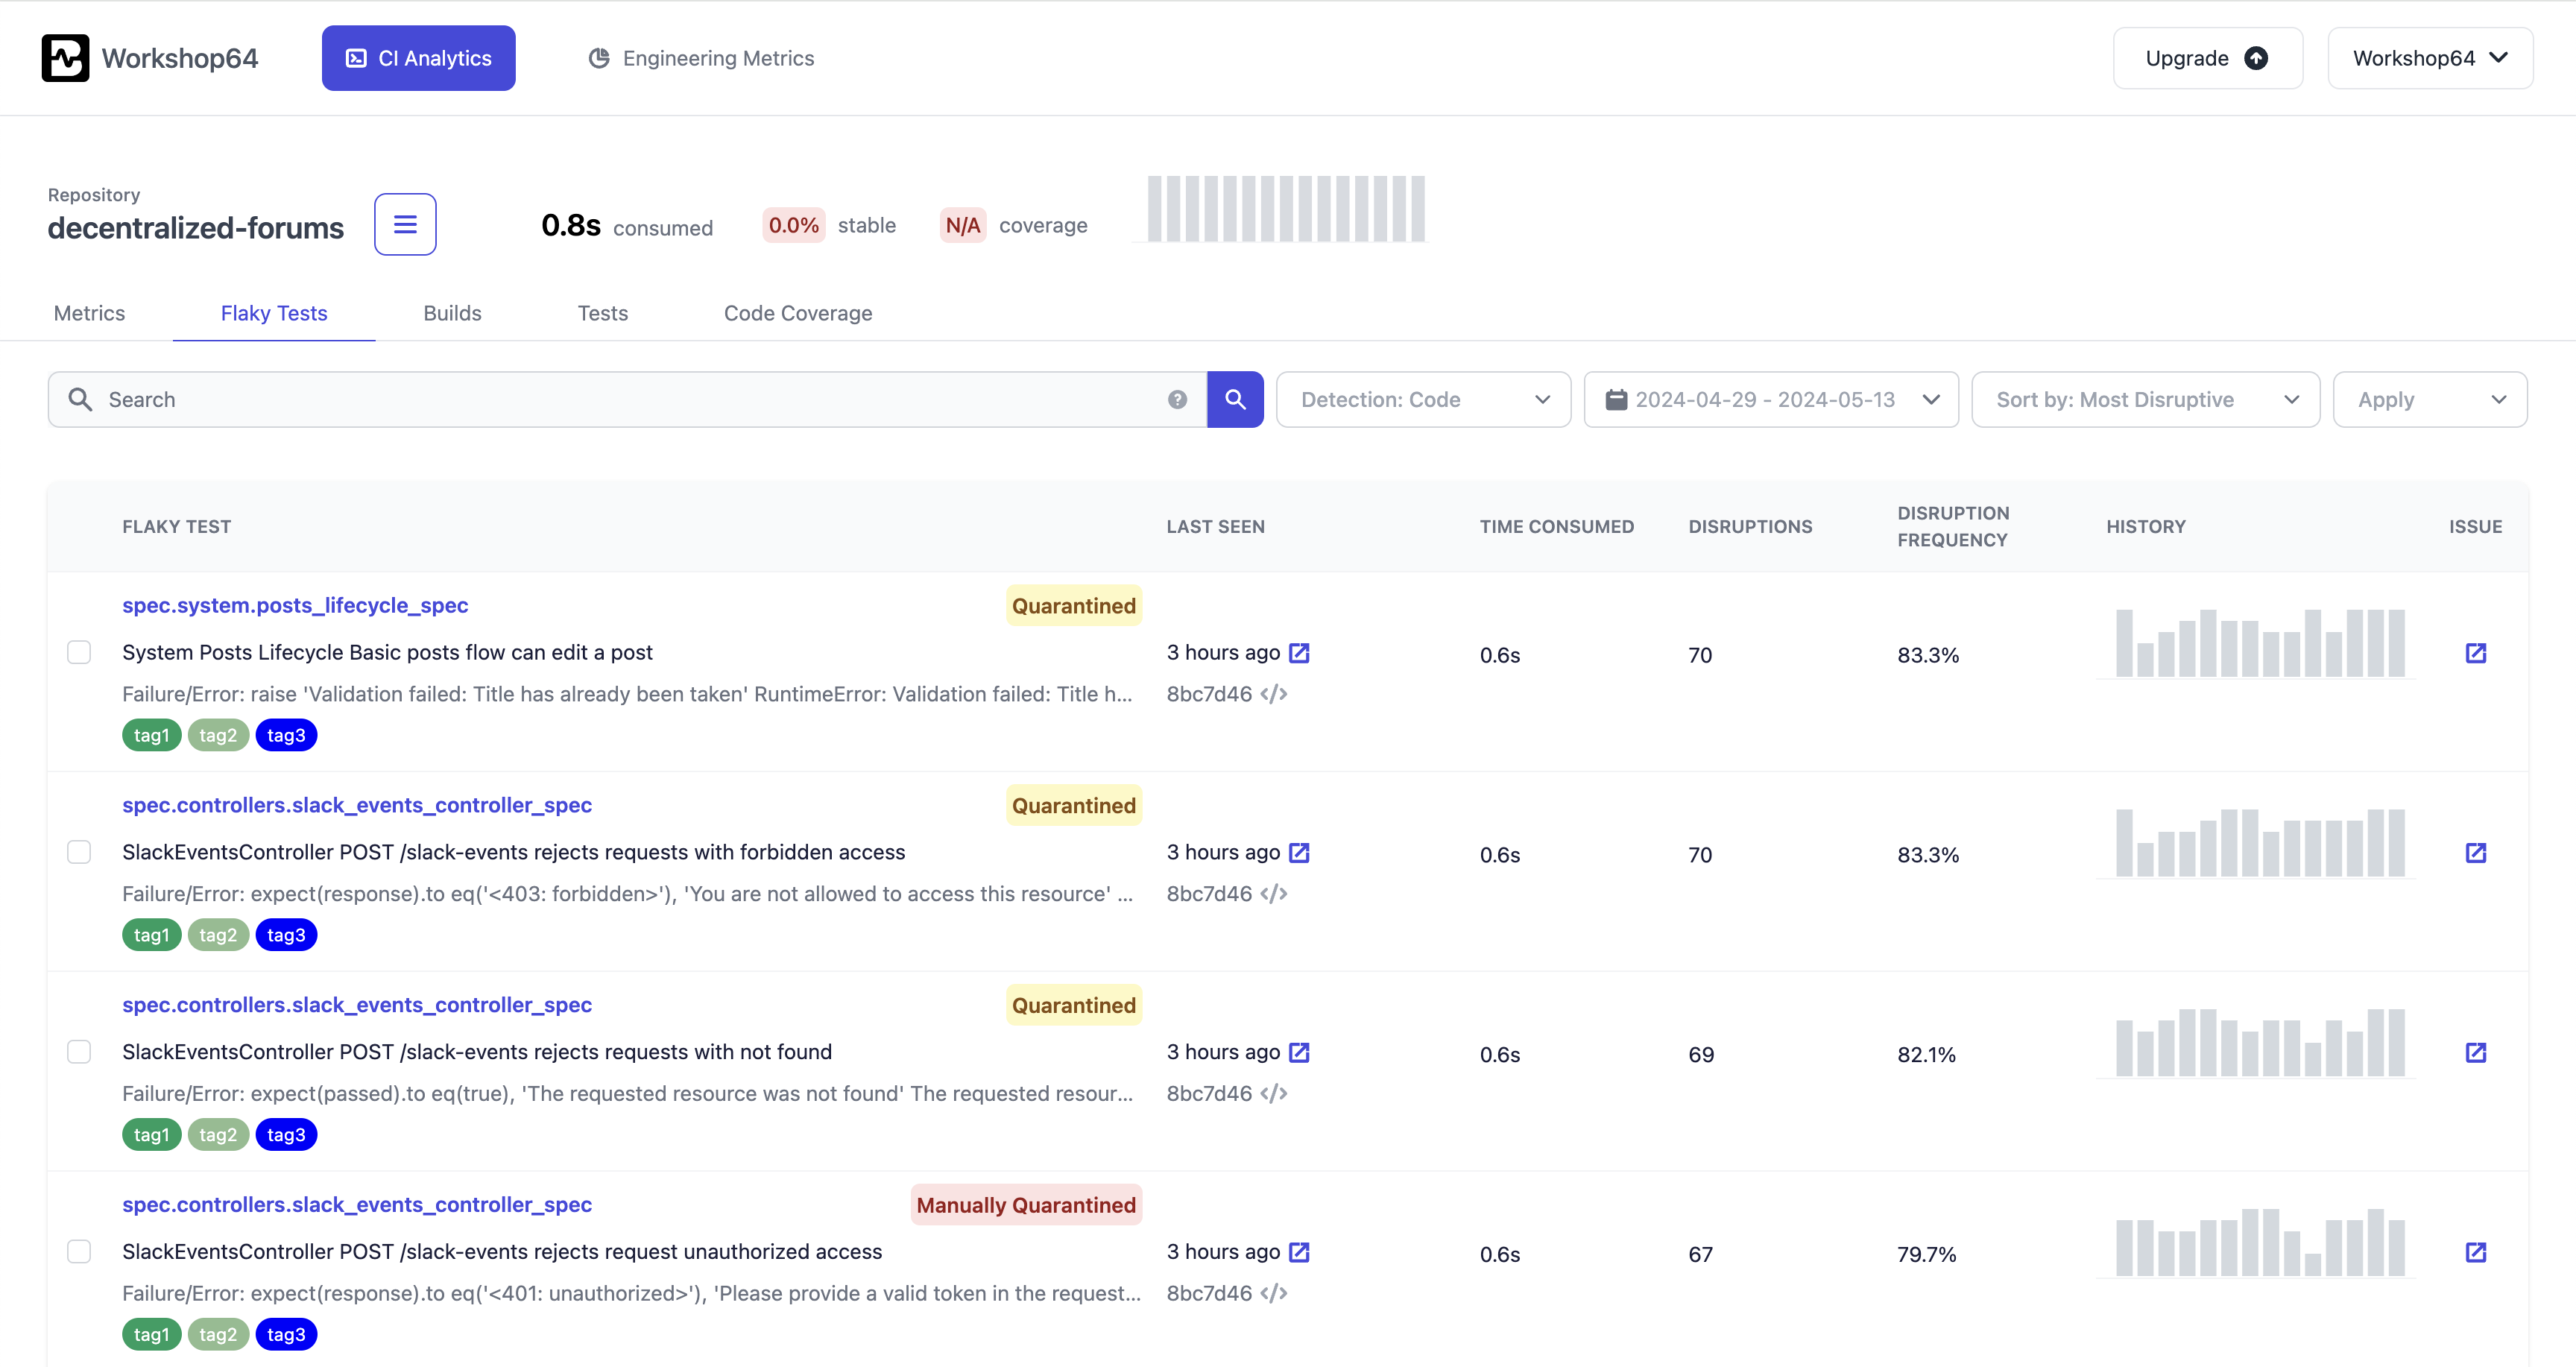
Flaky Tests Table
| Column | Description |
|---|---|
| Flaky Test | Detected flaky test case. This includes the test name, classname, portion of most recent failure message, tags associated with the test, and quarantine status. Hovering over the quarantine label will show the quarantine date. |
| Last Seen | Date and links to commit and build URL of the last seen flaky disruption. |
| Time Consumed | Sum of all builds that failed due to the corresponding flaky test. |
| Disruptions | Number of flaky failures for the corresponding flaky test. If Git-Based flaky test, then it's the number of disruptions (pass and fail flips), and if Statistical flaky test, then number of failures. |
| Disruption Frequency | Percentage of times the corresponding flaky test fails due to flakiness. This is the (disruptions/total number of results for test case) * 100 |
| History | Bar graph of the number of disruptions over time for the corresponding flaky test. |
| Issue | Create or view created issue. See Project Management Integrations. |
Filtering and Sorting
There are different ways to filter and sort flaky tests on the dashboard:
Detection: Detection method used to identify flaky tests.
- Code: Flaky tests detected by comparing git tree SHAs.
- Statistical: Flaky tests detected by analyzing test case failures. If failure rate exceeds a configured threshold, the test is marked as statistically flaky.
- Non-Flaky: Tests that are not flaky, but have been manually quarantined.
- Groups: Groups of flaky test cases that fail together.
Date Range: Filter flaky tests by disruptions seen within a specific date range. Default is past 14 days.
Sort By: Order tests by Most Disruptive, Most Recent, or Quarantined.
- Most Disruptive: Order tests by the number of flaky failures.
- Most Recent: Order tests by last seen flaky failure.
- Quarantined: Order tests by quarantine status. Manually quarantined tests are listed first, followed by automatically quarantined tests, and lastly, non-quarantined tests.
Apply: Select tests to apply manual quarantining, or un-quarantining.